Category: Azure Virtual Desktop

  • Habit #7: Optimise Log Analytics

    Habit #7: Optimise Log Analytics

    Visibility is essential — but it shouldn’t come at any cost.

    Monitoring is a critical part of running Azure Virtual Desktop.

    Without it, you’re blind to performance issues, login delays, and user experience problems.

    But there’s a trade-off that many teams don’t fully realise:

    Observability isn’t free.

    And in many environments, Log Analytics quietly becomes one of the largest — and least optimised — costs in Azure.

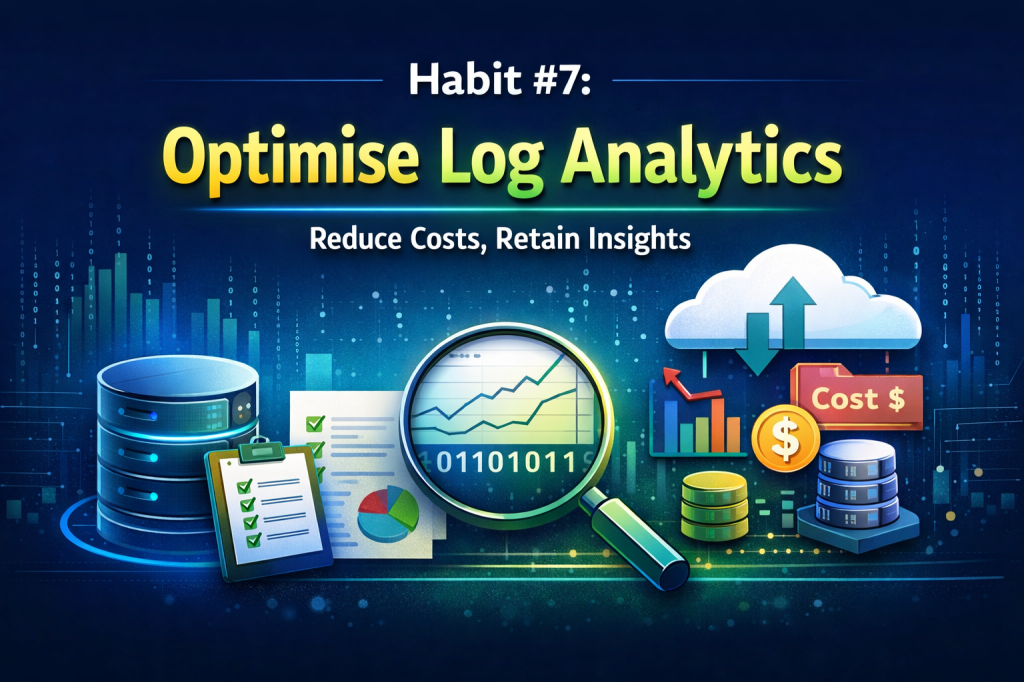
    That’s where Habit #7 comes in.

    Highly effective admins don’t just enable monitoring.
    They optimise it.


    The Hidden Cost of Visibility

    Log Analytics is incredibly powerful.

    It provides deep visibility into:

    • Session performance
    • User experience
    • Host health
    • Application behaviour

    But it works by ingesting data.

    And in Azure, you don’t pay for storing most of that data (at least initially).
    You pay for ingesting it.

    That means:

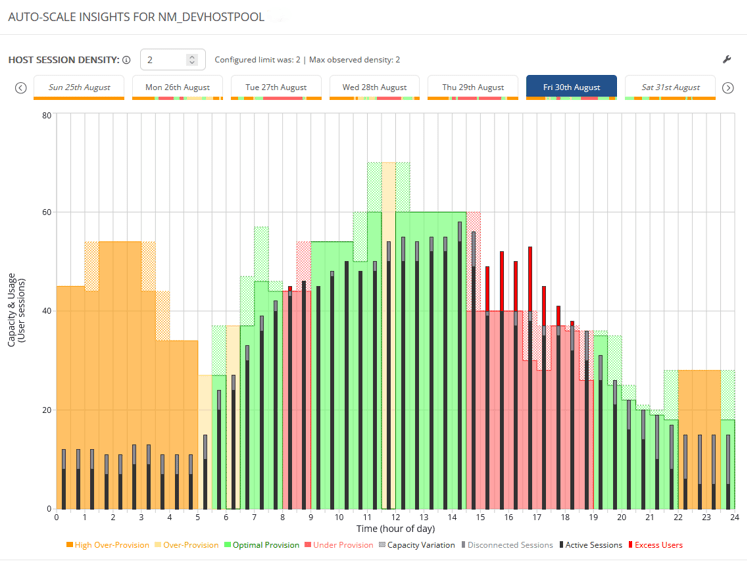
    The more frequently you collect data, the more you pay.

    In many AVD environments, default configurations collect data far more frequently than needed for day-to-day operations.

    The result?

    High ingestion volumes… and unexpectedly high costs.


    What Log Analytics Optimisation Really Means

    Optimising Log Analytics isn’t about turning monitoring off.

    It’s about collecting the right data, at the right frequency, for the right purpose.

    In Nerdio Manager for Enterprise, admins have control over how telemetry is collected and retained.

    This includes:

    • Data collection frequency (polling intervals)
    • Performance counters being captured
    • Retention periods

    The goal isn’t to reduce visibility.

    It’s to remove unnecessary noise.


    The Three Pillars of Habit #7

    Like every habit in this series, this comes down to consistent, repeatable behaviour.


    Pillar 1: Review What You’re Collecting

    Most environments collect far more data than they actually use.

    Highly effective admins regularly review:

    • Which performance counters are enabled
    • Whether those metrics are actively used
    • Which dashboards or reports depend on them

    A simple question helps guide this:

    “If we stopped collecting this data, would anyone notice?”

    If the answer is no, it’s likely unnecessary.


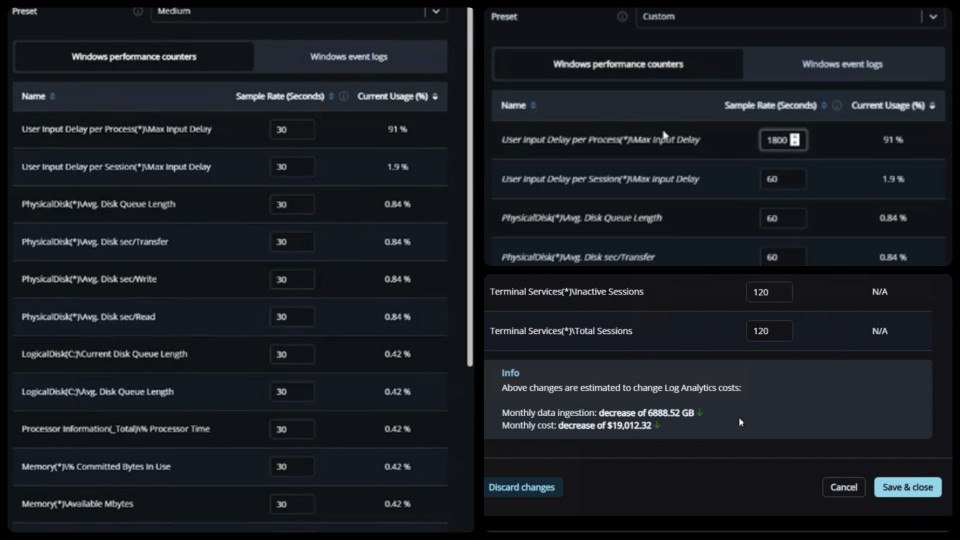
    Pillar 2: Adjust Collection Frequency

    One of the biggest cost drivers in Log Analytics is how frequently data is collected.

    By default, many metrics are captured every 30 seconds.

    For most environments, that level of granularity isn’t required.

    Adjusting polling intervals to:

    • 60 seconds
    • 120 seconds
    • Or even longer for certain metrics

    …can significantly reduce ingestion volume without materially impacting visibility.

    The data is still there.

    It’s just collected more efficiently.

    Log Analytics Optimisation in Nerdio Manager.

    Pillar 3: Align Retention with Real Needs

    Not all data needs to be kept forever.

    Highly effective admins:

    • Align retention periods with operational requirements
    • Keep short-term data for troubleshooting
    • Retain longer-term data only where it adds value

    For many teams, a 30-day retention window is more than sufficient for operational analysis.

    Anything beyond that should be intentional.


    What This Habit Enables

    When Log Analytics is optimised properly:

    • Monitoring costs drop significantly
    • Data ingestion becomes predictable
    • Dashboards remain effective
    • Troubleshooting capability is preserved

    Most importantly:

    You maintain visibility — without overpaying for it.


    Common Mistakes to Avoid

    Log Analytics optimisation is often overlooked or misunderstood.

    Some common pitfalls include:

    • Leaving default collection settings unchanged
    • Collecting high-frequency data that’s never used
    • Retaining data longer than necessary
    • Reducing data collection too aggressively without understanding impact

    The goal is balance.

    Too much data increases cost.
    Too little data reduces visibility.


    How Habit #7 Builds on the Previous Habits

    By this stage, the environment should already be well optimised:

    • Images are standardised
    • Patching is predictable
    • Applications are decoupled
    • Autoscale is tuned
    • VM sizing is aligned with demand

    Habit #7 completes the picture.

    It ensures that the monitoring layer itself is optimised, not just the infrastructure it observes.


    The Real Takeaway

    Monitoring is essential.

    But more data doesn’t always mean more value.

    Highly effective admins understand this.

    They don’t collect everything.

    They collect what matters.

    And they do it efficiently.


    Closing the Series

    That’s the final habit in the series.

    The 7 Habits of Highly Effective Nerdio Admins aren’t about individual features.

    They’re about operational discipline:

    • Build consistently
    • Patch predictably
    • Separate concerns
    • Optimise continuously
    • Use data to drive decisions

    Individually, each habit adds value.

    Together, they create environments that are:

    • Stable
    • Scalable
    • Cost-efficient
    • Predictable

    And ultimately — easier to manage.

  • Habit #6: Regularly Right-Size Using Nerdio Advisor

    Habit #6: Regularly Right-Size Using Nerdio Advisor

    The environment you designed six months ago probably isn’t the environment you’re running today.

    Most Azure Virtual Desktop environments start out well-designed.

    VM sizes are carefully chosen.
    Host pool capacity is planned.
    Autoscale is configured.

    At the beginning, everything fits.

    But environments rarely stay static.

    Users come and go.
    Applications change.
    Workloads evolve.

    Over time, what was once the right size often becomes the wrong size.

    That’s why Habit #6 exists.

    Highly effective admins don’t assume their original VM sizing decisions are still correct.

    They validate them regularly.


    Environment Drift Is Inevitable

    Even the most disciplined environments drift.

    Over time, you may see:

    • Increased user density on session hosts
    • New applications changing resource demands
    • Departments adopting new workflows
    • Seasonal fluctuations in usage

    None of this means that something was configured incorrectly.

    It simply means the environment evolved.

    The risk comes when sizing decisions stay frozen while everything else changes.

    That’s where right-sizing becomes essential.


    What Right-Sizing Actually Means

    Right-sizing isn’t about aggressively shrinking VM sizes.

    It’s about aligning infrastructure with real demand.

    In Nerdio Manager for Enterprise, Nerdio Advisor helps surface opportunities where VM sizes or host counts no longer match usage patterns.

    It analyses:

    • CPU utilisation trends
    • Memory utilisation
    • Host density
    • Historical workload behaviour

    From this data, it can highlight potential opportunities to:

    • Reduce VM size
    • Adjust host counts
    • Improve session density
    • Eliminate unused capacity

    Advisor doesn’t force changes.

    It simply shows where optimisation may exist.


    The Three Pillars of Habit #6

    Like the other habits in this series, right-sizing becomes effective when it’s treated as a repeatable behaviour rather than a one-time task.


    Pillar 1: Review Advisor Recommendations Regularly

    Right-sizing should be part of your operational rhythm.

    Highly effective admins review Advisor recommendations periodically to understand how their environment is evolving.

    These reviews help answer questions such as:

    Are hosts consistently underutilised?
    Are machines running close to resource limits?
    Has user demand changed since the environment was first deployed?

    Looking at these trends regularly prevents small inefficiencies from turning into long-term overspend.


    Pillar 2: Validate Host Pool Sizing Against Real Demand

    Advisor recommendations are a starting point.

    Before making changes, administrators should validate recommendations against how the environment is actually used.

    Important considerations include:

    • Login storms
    • Peak usage periods
    • Critical applications
    • Future growth expectations

    Right-sizing should always balance efficiency with user experience.

    The goal is optimisation — not risk.


    Pillar 3: Make Incremental Adjustments

    The most successful optimisation strategies are gradual.

    Highly effective admins:

    • Test smaller VM sizes in validation pools
    • Adjust session density carefully
    • Monitor performance after changes
    • Iterate based on real results

    This approach ensures improvements are sustainable and predictable.

    Large, aggressive changes introduce uncertainty.

    Small, measured adjustments build confidence.


    What This Habit Enables

    When environments are regularly right-sized, several things happen.

    First, infrastructure becomes more efficient.

    Unused capacity is eliminated, and VM sizes better match the workloads they support.

    Second, costs become more predictable.

    Right-sizing ensures organisations are paying for what they actually use — not what they once needed.

    Finally, operational confidence improves.

    Administrators know their environment reflects current demand rather than historical assumptions.


    Common Mistakes to Avoid

    Right-sizing is powerful, but it can be misunderstood.

    Some common pitfalls include:

    • Treating right-sizing as a one-time exercise
    • Blindly applying recommendations without validation
    • Optimising based on short-term usage spikes
    • Reducing VM sizes too aggressively

    Good optimisation is disciplined.

    It balances cost efficiency with stability.


    How Habit #6 Builds on the Previous Habits

    By the time organisations reach Habit #6, the earlier habits have already created a stable foundation.

    Images are standardised.
    Patching is predictable.
    Applications are decoupled from images.
    Autoscale behaviour is understood.

    Only once that foundation exists does right-sizing become safe.

    Without it, changing VM sizes can introduce instability.

    With it, right-sizing becomes one of the most powerful cost optimisation tools available.


    The Real Takeaway

    Infrastructure decisions age.

    What worked six months ago may not be optimal today.

    Highly effective admins recognise this.

    They don’t rely on past assumptions.

    They validate them.

    Regular right-sizing ensures that the environment you’re running today reflects the demands of today — not the design decisions of yesterday.

    That’s the essence of Habit #6.


    Next in the series:
    Habit #7 — Optimise Log Analytics

    Monitoring is essential for maintaining visibility into your environment, but unmanaged telemetry can quietly inflate Azure costs. The final habit explores how to maintain observability while keeping analytics costs under control.

  • Habit #5: Analyse Auto-Scale History

    Habit #5: Analyse Auto-Scale History

    Insights show what might be wrong. History tells you why.

    Auto-scale is designed to react to demand.

    Users log in → hosts scale out.
    Users log off → hosts scale in.

    Simple in theory.

    But in the real world, Auto-Scale behaviour can sometimes look confusing:

    • Hosts scale out earlier than expected
    • Machines stay online when no users remain
    • Capacity spikes suddenly
    • Scaling appears inconsistent

    When this happens, many admins immediately start tweaking auto-Scale settings.

    The most effective admins do something different first.

    They look at the history.


    Auto-Scale Behaviour Often Tells a Story

    When Auto-Scale behaves in ways that seem unexpected, it’s rarely a bug.

    More often, it’s Auto-Scale doing exactly what it was configured to do — just reacting to signals you might not have noticed.

    Auto-Scale makes decisions based on inputs such as:

    • Active user sessions
    • CPU utilisation
    • Memory utilisation
    • Session limits
    • Time-based schedules

    If any of these signals change, Auto-Scale responds.

    Without reviewing historical behaviour, those responses can feel random.

    But once you analyse the history, patterns start to emerge.


    What Auto-Scale History Reveals

    Auto-Scale History in Nerdio Manager for Enterprise provides a timeline of scaling behaviour so you can understand exactly what happened.

    It allows administrators to see:

    • When scale-out events occurred
    • When hosts scaled back in
    • What triggered each scaling decision
    • How host capacity changed throughout the day

    Instead of guessing why Auto-Scale reacted, you can see the reasoning behind every action.

    This turns Auto-Scale from a black box into an explainable system.


    The Three Pillars of Habit #5

    Highly effective admins don’t just glance at Auto-Scale history when something goes wrong.

    They analyse it regularly.

    Three behaviours make this habit effective.


    Pillar 1: Correlate Scale Events with User Activity

    Auto-Scale should follow user demand.

    That means scale-out events should align closely with increases in user sessions.

    By reviewing Auto-Scale history alongside session activity, you can identify patterns such as:

    • Morning login storms
    • Midday workload peaks
    • Shift-based usage patterns
    • End-of-day session drop-offs

    When scaling events align with user behaviour, your Auto-Scale configuration is doing its job.

    If scaling happens too early or too late, it may indicate that thresholds or session limits need adjustment.

    The key is understanding how demand drives capacity.


    Pillar 2: Analyse Resource Utilisation Trends

    User sessions alone don’t tell the whole story.

    Resource utilisation often reveals why Auto-Scale behaves the way it does.

    Review historical trends for:

    • CPU utilisation
    • Memory utilisation
    • Average sessions per host

    These metrics help answer important questions:

    Are hosts consistently underutilised?
    Are machines running near capacity?
    Are session limits too conservative?

    In many environments, utilisation data quickly reveals opportunities to right-size VM families or adjust session density.

    Without this context, Auto-Scale decisions can appear unpredictable.

    With it, they become completely logical.


    Pillar 3: Identify Inefficient Scaling Patterns

    Auto-Scale history also helps reveal inefficiencies that quietly increase costs.

    Examples include:

    • Hosts running overnight with no active sessions
    • Scale-out events creating more hosts than needed
    • Frequent scale-in and scale-out oscillations
    • Burst hosts being created unnecessarily

    One-off events rarely matter.

    Patterns do.

    When these patterns appear repeatedly, they often indicate that scaling thresholds or schedules can be refined.

    Small adjustments can eliminate significant waste over time.


    What This Habit Enables

    When administrators regularly analyse Auto-Scale history, scaling becomes predictable.

    Instead of reacting to unexpected behaviour, teams gain:

    • Clear visibility into scaling decisions
    • Faster troubleshooting when anomalies occur
    • Evidence-based optimisation
    • Improved cost control
    • Greater confidence in Auto-Scale configuration

    Auto-Scale stops feeling mysterious.

    It becomes something you understand and control.


    Common Mistakes to Avoid

    Even experienced teams can misinterpret Auto-Scale behaviour.

    Some common pitfalls include:

    • Reviewing only one day of historical data
    • Optimising around short-term anomalies
    • Ignoring weekly or seasonal usage patterns
    • Adjusting Auto-Scale settings without understanding triggers

    Auto-Scale optimisation works best when decisions are based on consistent trends rather than isolated events.

    Looking at several weeks of history often reveals the true behaviour of an environment.


    How Habit #5 Builds on Habit #4

    Habit #4 focused on Auto-Scale Insights.

    Insights help surface potential optimisation opportunities — such as idle capacity or oversized VM SKUs.

    Habit #5 goes one step further.

    It explains why those opportunities exist.

    When you combine insights with historical analysis, you create a powerful feedback loop:

    Insights highlight optimisation opportunities.
    History explains the behaviour behind them.

    Together, they allow admins to refine Auto-Scale configurations with confidence.


    The Operational Discipline Behind Great Environments

    The most stable Azure Virtual Desktop (AVD) environments don’t rely on trial and error.

    They rely on observation.

    Highly effective teams treat Auto-Scale history as part of their operational routine.

    They review it:

    • During monthly environment reviews
    • When investigating performance issues
    • After major application or user changes
    • When evaluating cost optimisation opportunities

    Over time, this creates a deeper understanding of how the environment behaves.

    And that understanding leads to better decisions.


    The Real Takeaway

    Auto-Scale isn’t magic.

    It’s simply a system responding to signals.

    When those signals are understood, scaling becomes predictable.

    And predictable systems are easier to optimise.

    That’s the real value of Habit #5.


    Next in the series:
    Habit #6 — Regularly Right-Size Using Nerdio Advisor

    Even well-designed environments drift over time. The most effective admins continuously validate that their VM sizing still reflects real demand.

  • Habit #4: Act on Auto-Scale Insights

    Habit #4: Act on Auto-Scale Insights

    Don’t set it and forget it.

    Auto-scale is one of the most powerful features in Azure Virtual Desktop.

    It promises elasticity.
    It promises cost control.
    It promises performance stability.

    But here’s the reality:

    Most environments drift.

    Auto-scale gets configured once — often during deployment — and then quietly left alone. Months later, usage patterns have changed, user numbers have shifted, and application behaviour has evolved… but scaling logic hasn’t.

    That’s where Habit #4 comes in.

    Highly effective Nerdio admins don’t treat auto-scale as a static configuration.
    They treat it as a feedback loop.


    Auto-Scale Drift Is Normal

    Even well-designed environments don’t stay optimal forever.

    Over time:

    • Users join or leave
    • Working hours shift
    • Seasonal spikes come and go
    • Applications change resource profiles

    None of this means the original configuration was wrong.

    It just means the environment evolved.

    The problem isn’t drift.
    The problem is ignoring it.


    What Auto-Scale Insights Actually Do

    Auto-Scale Insights in Nerdio Manager for Enterprise surface where your configuration no longer reflects reality.

    They highlight:

    • Idle capacity
    • Inefficient scaling schedules
    • Burst logic that may be too conservative — or too aggressive

    Insights don’t make changes for you.
    They show you where opportunity exists.

    They turn instinct into evidence.


    The Three Pillars of Habit #4

    Like the other habits, this one breaks down into repeatable behaviours.

    You don’t need a dramatic reconfiguration.
    You need a disciplined review.


    Pillar 1: Review Insights Regularly

    Auto-scale should have an operational cadence.

    Highly effective admins:

    • Review Insights monthly (or at minimum quarterly)
    • Look for trends, not one-off anomalies
    • Treat it like a performance and cost dashboard

    Small adjustments made regularly compound over time.

    What’s dangerous isn’t one imperfect configuration.
    It’s leaving it untouched for a year.


    Pillar 2: Validate Provisioning Against Real Usage

    The question isn’t “Is autoscale enabled?”

    The question is:

    Does our current provisioning reflect how the environment is actually being used?

    Review:

    • Active and disconnected sessions per host
    • Scale-out frequency
    • Ramp, peak, and taper events
    • Host counts during low-demand periods

    As a general rule of thumb, sustained utilisation below ~60% often signals overprovisioning. Sustained utilisation above ~80% may indicate constrained performance.

    The goal isn’t to chase perfect numbers.

    The goal is alignment between capacity and demand.


    Pillar 3: Optimise Safely, Not Aggressively

    Cost optimisation should be invisible to users.

    Highly effective admins:

    • Adjust VM size incrementally
    • Modify session limits gradually
    • Tune burst thresholds cautiously
    • Validate performance after changes

    Aggressive optimisation introduces risk.

    Disciplined optimisation builds confidence.


    What This Enables

    When Auto-Scale Insights are acted on consistently:

    • Compute costs drop meaningfully
    • Scaling becomes predictable
    • Surprise overruns decrease
    • Performance stabilises

    More importantly, optimisation becomes a data exercise — not guesswork.

    This aligns strongly with my broader emphasis on disciplined, data-driven decision making.


    Common Mistakes to Avoid

    Even experienced teams fall into these traps:

    • Blindly applying every recommendation without context
    • Optimising based on one week of data
    • Ignoring seasonal workload patterns
    • Tuning autoscale before stabilising images and applications

    Order matters.

    Autoscale optimisation works best when:

    • Images are consistent
    • Patching is predictable
    • Applications are disciplined

    That foundation makes scaling behaviour easier to interpret — and safer to adjust.


    How Habit #4 Builds on the Foundation

    Habit #4 doesn’t stand alone.

    It builds on:

    • Habit #1: Standardised image management
    • Habit #2: Predictable patching
    • Habit #3: Controlled application delivery

    Only when the environment is stable does autoscale optimisation become safe.

    Otherwise, you’re just scaling instability faster.


    The Real Takeaway

    Autoscale isn’t about turning machines on and off.

    It’s about continuously aligning capacity with reality.

    Set it.
    Measure it.
    Refine it.

    That’s the habit.


    Next up: Habit #5 — Analyse Auto-Scale History
    Insights show what might be wrong. History tells you why.

  • March 31, 2026, is coming: New Azure VNets won’t have outbound internet by default — here’s the EUC-ready fix (NAT Gateway v2)

    March 31, 2026, is coming: New Azure VNets won’t have outbound internet by default — here’s the EUC-ready fix (NAT Gateway v2)

    The change that won’t hurt… until it does

    If you run Azure Virtual Desktop (AVD) or Windows 365 (Cloud PCs) in Azure, you’ve probably relied on a quiet convenience for years:

    Deploy a VM in a subnet and—without doing anything special—it can reach the internet.

    That “it just works” behavior is going away by default for new networks.

    Microsoft has confirmed that after March 31, 2026, newly created Azure Virtual Networks will default to private subnets, meaning no default outbound internet access unless you explicitly configure an outbound method.

    And here’s the trap: nothing breaks on day one. Your existing VNets keep working as they do today. Then, weeks later, someone builds a new VNet (or a new subnet), tries to deploy AVD session hosts or provision Cloud PCs… and suddenly:

    • Hosts can’t download what they need
    • Windows activation and updates don’t behave
    • Intune enrollment/sync gets weird
    • Provisioning workflows fail in ways that look like “AVD is broken” (it’s not)

    Microsoft explicitly notes that certain services (including Windows activation and Windows updates) won’t function in a private subnet unless you add explicit outbound connectivity.

    So, let’s make this change boring—in a good way. ✅


    What exactly is changing on March 31, 2026?

    ✅ What changes

    • New VNets created after March 31, 2026 will default to private subnets (Azure sets the subnet property defaultOutboundAccess = false by default).
    • Private subnets mean VMs do not get “default outbound access” to the internet or public Microsoft endpoints unless you configure an explicit egress method.

    ✅ What does not change

    • Existing VNets are not automatically modified.
    • New VMs deployed into existing VNets will continue to behave as those subnets are configured today, unless you change those subnets.

    Also important: you still have control

    Microsoft’s guidance is “secure by default,” but you can still configure subnets as non-private if you truly need to keep the default outbound behavior for a period of time.
    That said… for EUC, the better long-term move is to standardize on explicit outbound now.


    Why AVD and Windows 365 teams should care (more than most)

    EUC workloads have a long list of dependencies on outbound connectivity. A few high-impact examples:

    AVD session hosts

    • Agent/bootloader downloads and updates
    • Host registration and service connectivity
    • Windows activation + KMS / public activation flows
    • Windows Update / Defender updates
    • App install flows that fetch from internet endpoints (MSIX, Winget, vendor CDNs, etc.)
    • Telemetry and management paths (depending on your architecture)

    Windows 365 (Azure Network Connection / ANC)

    Microsoft is explicit here: for Windows 365 ANC deployments using VNets created after March 31, 2026, Cloud PC provisioning will fail unless outbound internet access is explicitly configured.

    So the question becomes: what’s the cleanest, most repeatable outbound design for EUC networks?


    Your outbound options (EUC decision guide)

    Azure recognizes several “explicit outbound” patterns.
    For EUC, these are the common ones:

    1) NAT Gateway (recommended default for most EUC spokes)

    Best when:

    • You want simple, scalable outbound for session hosts / Cloud PCs
    • You need a predictable egress IP for allow-lists
    • You don’t need deep L7 inspection for all traffic (or you’re doing that elsewhere)

    2) Firewall/NVA + UDR (hub-and-spoke inspection)

    Best when:

    • You need central inspection, TLS break/inspect, egress filtering at scale
      Trade-offs:
      • Complexity and cost
      • SNAT scaling considerations
      • You may still use NAT Gateway with firewall designs (more on that below)

    3) Standard Load Balancer outbound rules

    Best when:

    • You already have SLB, and outbound rules are a deliberate part of your design
      Trade-offs:
    • More moving parts than NAT Gateway for a simple “give the subnet internet” outcome

    4) Public IP per VM (usually a “no” for EUC)

    Trade-offs:

    • Operational overhead
    • Increased attack surface
    • Harder to govern at scale for pooled hosts / Cloud PCs

    For most AVD and Windows 365 environments, the sweet spot is:
    ➡️ NAT Gateway for outbound simplicity and scale.

    And now we have a better version of it.


    Enter NAT Gateway v2: the “make it simple” fix

    Microsoft announced StandardV2 NAT Gateway and StandardV2 Public IPs to match it. The headline improvements are exactly what EUC architects care about:

    • Zone-redundant by default (in regions with Availability Zones)
    • Higher performance (Microsoft calls out up to 100 Gbps throughput and 10 million packets/sec)
    • IPv6 support
    • Flow logs support
    • Same price as Standard NAT Gateway (per Microsoft’s announcement)

    But know the gotchas

    From Microsoft’s NAT SKU guidance:

    • Requires StandardV2 Public IPs (Standard PIP won’t work)
    • No in-place upgrade from Standard → StandardV2 NAT Gateway (replace it)
    • Some regions don’t support StandardV2 NAT Gateway (check your target region list)

    If you’re designing for EUC scale + resilience, the zone redundancy alone is a big deal.


    Walkthrough: Deploy NAT Gateway v2 for AVD / Windows 365

    Below is a practical, EUC-focused setup using the Azure portal.

    Architecture target

    • You have a VNet with one or more EUC subnets (e.g., AVD-Hosts, CloudPCs)
    • You attach one NAT Gateway v2 to those subnets
    • All outbound traffic from those subnets egresses via the NAT’s public IP(s)

    NAT Gateway is associated at the subnet level, and a subnet can only use one NAT gateway at a time (so plan accordingly).


    Step 0: Confirm your subnet posture (private vs not)

    After March 31, 2026, new VNets will default to private subnets.

    In the subnet configuration in Azure:

    • Find Default outbound access
    • If you want the secure-by-default posture, set it Disabled (private subnet)
    • Then ensure you provide explicit outbound (NAT Gateway)

    Note: if you change an existing subnet’s default outbound access setting, existing VMs may need a stop/deallocate to fully apply the change.


    Step 1: Create a StandardV2 Public IP

    NAT Gateway v2 requires a StandardV2 Public IP.

    Azure portal:

    1. Create Public IP address
    2. Set:
      • SKU: StandardV2 (static)
      • IP version: IPv4 (or dual-stack if required)
    3. Create it

    Step 2: Create the NAT Gateway (StandardV2)

    Azure portal:

    1. Create NAT gateway
    2. Set:
      • SKU: StandardV2
      • TCP idle timeout: leave default unless you have a reason
    3. On Outbound IP, attach the StandardV2 Public IP you created
    4. Create

    Microsoft’s announcement emphasizes StandardV2 NAT Gateway is zone-redundant by default in AZ regions.


    Step 3: Attach NAT Gateway v2 to your EUC subnet(s)

    Now associate it with the subnets where your session hosts / Cloud PCs live.

    Option A (from NAT Gateway):

    • NAT Gateway → Networking → add VNet/subnet associations

    Option B (from Subnet):

    • VNet → Subnets → select subnet → set NAT gateway → Save

    Once attached:

    • VMs in that subnet gain outbound connectivity through the NAT Gateway
    • Your egress IP becomes the NAT’s public IP (useful for allow-listing)

    Step 4: Validate (don’t skip this)

    For EUC, I like three quick validations:

    1. Effective routes
    • Confirm the subnet has the expected path for internet-bound traffic (0.0.0.0/0) via the platform egress with NAT.
    1. Outbound IP check
    • From a session host / Cloud PC, verify outbound IP matches your NAT public IP.
    1. EUC-specific smoke tests
    • Windows activation / licensing behavior
    • Windows Update connectivity
    • Intune enrollment/sync (if applicable)
    • Any app deployment mechanisms that pull from vendor CDNs

    Remember: Microsoft explicitly warns that private subnets need explicit outbound for services like Windows activation/updates.


    Common EUC deployment patterns (what I recommend)

    Pattern A: “EUC spoke NAT” (simple + effective)

    • Each EUC spoke VNet has a NAT Gateway v2 attached to EUC subnets
    • Keep routing simple
    • Use NSGs for egress control + consider NAT flow logs for visibility (where needed)

    Pattern B: “Hub inspection + NAT scale”

    If you route everything through a firewall/NVA for inspection, NAT Gateway can still be relevant in designs where you need scalable SNAT characteristics for outbound (especially when you’ve seen firewall SNAT constraints in the wild). This becomes an architecture conversation, but the key is: private subnets force you to be explicit, and NAT Gateway is the simplest explicit egress building block.


    “Do this before March 31, 2026” checklist

    For AVD admins, Windows 365 admins, and EUC architects:

    • Identify where your org creates “new VNets” (projects, regions, subscriptions)
    • Update your EUC network templates to include explicit outbound (NAT Gateway v2 is the default pick)
    • Standardize an allow-listing approach using the NAT’s static public IP(s)
    • Decide logging posture (do you want NAT flow logs for troubleshooting/top talkers?)
    • Run a “new VNet” dry run now (don’t wait for the deadline)
    • For Windows 365 ANC: confirm your provisioning pipelines won’t fail on new VNets without explicit outbound

    Final thought: make your cloud consistent

    This change is “secure by default,” but operationally it creates a nasty split-brain risk: old VNets behave one way, new VNets behave another.

    The easiest way to keep EUC stable is to choose a consistent outbound pattern everywhere. For most AVD + Windows 365 environments, NAT Gateway v2 is the cleanest baseline: zone-resilient, scalable, and straightforward to operate.

  • Goodbye Hidden Single Points of Failure: AVD Regional Host Pools Explained

    Goodbye Hidden Single Points of Failure: AVD Regional Host Pools Explained

    What would you do if Azure went down in your region today?
    Not a total global outage — but a partial, messy one where your VMs are healthy, storage is fine, yet users still can’t connect.

    This scenario is why Microsoft has introduced Regional Host Pools for Azure Virtual Desktop, now available in public preview.

    This is not about making your session hosts multi-region.
    It is about removing a long-standing single point of failure in the AVD control plane.

    Let’s break down what’s changed, why it matters, and how to start using it.


    Azure resilience isn’t one thing — it’s layered

    Microsoft Azure resilience works across multiple layers:

    • Global geographies
    • Regions
    • Availability zones
    • Datacentres

    Some services (like Azure DNS or Front Door) are fully global.
    Others — virtual machines and storage — are tied to a region.

    AVD has always sat somewhere in between.

    • The control plane (metadata, brokering, app groups, workspaces) is globally distributed
    • But metadata databases were shared at a geography level

    That meant a database issue in one region could affect host pools in entirely different regions.

    Regional Host Pools are Microsoft’s fix for that architectural risk.


    What are Regional Host Pools?

    Historically, all AVD host pools used a geographical deployment model, where metadata was stored in a shared database for an entire Azure geography.

    With Regional Host Pools:

    • Each supported Azure region gets its own AVD metadata database
    • Metadata is still:
      • Replicated across availability zones
      • Replicated to a paired region for disaster recovery
    • But cross-region dependencies are removed

    The result:

    • Outages are isolated to a single region
    • The AVD control plane becomes significantly more resilient
    • You gain explicit control over where metadata lives

    This is especially important for:

    • Regulated industries
    • Public sector
    • Customers with strict data sovereignty requirements

    What actually changes when you deploy one?

    Functionally? Almost nothing.

    Architecturally? A lot.

    The only visible difference during deployment is a new field:

    Deployment Scope

    • Geographical (legacy)
    • Regional (new)

    Everything else — host pool type, validation environment, assignment type — stays the same.

    ⚠️ This does not:

    • Make session hosts multi-region
    • Replicate FSLogix profiles
    • Replace Azure Site Recovery

    It only hardens the AVD control plane.


    Public preview details (important)

    During preview:

    • Supported regions:
      • East US 2
      • Central US
    • Metadata is replicated between those paired regions
    • More regions will be added gradually as the service approaches GA

    Unsupported features (for now):

    • Session host configuration & updates
    • Dynamic autoscaling
    • Private Link
    • App Attach (still geographical only)
    • Log Analytics errors & checkpoints for regional hosts

    These will hopefully be fix by the time this feature goes GA.


    Enabling the preview

    Azure Portal

    1. Go to Subscriptions
    2. Select your subscription
    3. Settings → Preview features
    4. Register: AVD Regional Resources Public Preview

    PowerShell

    Register-AzProviderFeature `
    -ProviderNamespace Microsoft.DesktopVirtualization `
    -FeatureName AVDRegionalResourcesPublicPreview

    If you’re deploying via PowerShell, you’ll also need:

    • Az.DesktopVirtualization 5.4.5-preview
    • The -DeploymentScope Regional parameter

    Can you convert existing host pools?

    Not yet.

    Currently, you have three options:

    • Wait for Microsoft’s upcoming migration tooling
    • Create a new regional host pool, then:
      • Generate a new registration token
      • Reinstall the AVD agent
      • Move hosts across
    • Use this in testing and labs only (the safest option during preview)

    Also note:

    • Regional objects cannot be linked to geographical ones
    • Host pools, app groups, and workspaces must all share the same deployment scope

    Why this really matters

    Microsoft has been very clear:

    Regional host pools are the future of Azure Virtual Desktop.

    At some point:

    • Creating geographical host pools will be blocked
    • Geographical infrastructure will be retired
    • Regional will be the default — and the expectation

    This change:

    • Removes a hidden single point of failure
    • Improves outage isolation
    • Gives customers real control over metadata placement

    It’s one of the most meaningful architectural improvements AVD has had in years.


    Final thoughts

    If you’re running production workloads today:

    • Start planning your transition
    • Track feature parity as preview limitations close
    • Begin using regional host pools for new environments

    This isn’t a flashy feature — but it’s a foundational one.
    And those are usually the changes that matter most.