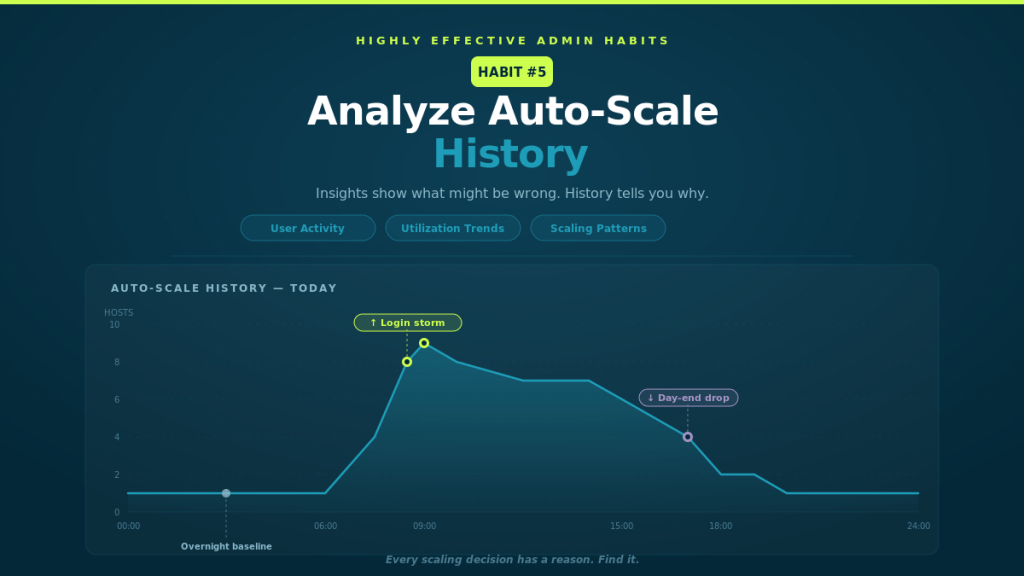
Insights show what might be wrong. History tells you why.
Auto-scale is designed to react to demand.
Users log in → hosts scale out.
Users log off → hosts scale in.
Simple in theory.
But in the real world, Auto-Scale behaviour can sometimes look confusing:
- Hosts scale out earlier than expected
- Machines stay online when no users remain
- Capacity spikes suddenly
- Scaling appears inconsistent
When this happens, many admins immediately start tweaking auto-Scale settings.
The most effective admins do something different first.
They look at the history.
Auto-Scale Behaviour Often Tells a Story
When Auto-Scale behaves in ways that seem unexpected, it’s rarely a bug.
More often, it’s Auto-Scale doing exactly what it was configured to do — just reacting to signals you might not have noticed.
Auto-Scale makes decisions based on inputs such as:
- Active user sessions
- CPU utilisation
- Memory utilisation
- Session limits
- Time-based schedules
If any of these signals change, Auto-Scale responds.
Without reviewing historical behaviour, those responses can feel random.
But once you analyse the history, patterns start to emerge.
What Auto-Scale History Reveals
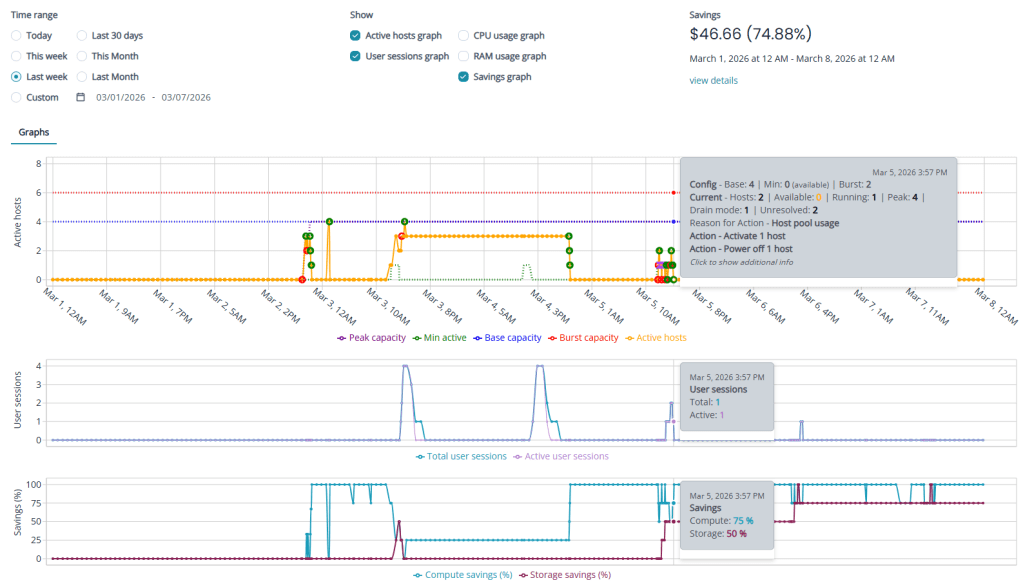
Auto-Scale History in Nerdio Manager for Enterprise provides a timeline of scaling behaviour so you can understand exactly what happened.
It allows administrators to see:
- When scale-out events occurred
- When hosts scaled back in
- What triggered each scaling decision
- How host capacity changed throughout the day
Instead of guessing why Auto-Scale reacted, you can see the reasoning behind every action.
This turns Auto-Scale from a black box into an explainable system.
The Three Pillars of Habit #5
Highly effective admins don’t just glance at Auto-Scale history when something goes wrong.
They analyse it regularly.
Three behaviours make this habit effective.
Pillar 1: Correlate Scale Events with User Activity
Auto-Scale should follow user demand.
That means scale-out events should align closely with increases in user sessions.
By reviewing Auto-Scale history alongside session activity, you can identify patterns such as:
- Morning login storms
- Midday workload peaks
- Shift-based usage patterns
- End-of-day session drop-offs
When scaling events align with user behaviour, your Auto-Scale configuration is doing its job.
If scaling happens too early or too late, it may indicate that thresholds or session limits need adjustment.
The key is understanding how demand drives capacity.
Pillar 2: Analyse Resource Utilisation Trends
User sessions alone don’t tell the whole story.
Resource utilisation often reveals why Auto-Scale behaves the way it does.
Review historical trends for:
- CPU utilisation
- Memory utilisation
- Average sessions per host
These metrics help answer important questions:
Are hosts consistently underutilised?
Are machines running near capacity?
Are session limits too conservative?
In many environments, utilisation data quickly reveals opportunities to right-size VM families or adjust session density.
Without this context, Auto-Scale decisions can appear unpredictable.
With it, they become completely logical.
Pillar 3: Identify Inefficient Scaling Patterns
Auto-Scale history also helps reveal inefficiencies that quietly increase costs.
Examples include:
- Hosts running overnight with no active sessions
- Scale-out events creating more hosts than needed
- Frequent scale-in and scale-out oscillations
- Burst hosts being created unnecessarily
One-off events rarely matter.
Patterns do.
When these patterns appear repeatedly, they often indicate that scaling thresholds or schedules can be refined.
Small adjustments can eliminate significant waste over time.
What This Habit Enables
When administrators regularly analyse Auto-Scale history, scaling becomes predictable.
Instead of reacting to unexpected behaviour, teams gain:
- Clear visibility into scaling decisions
- Faster troubleshooting when anomalies occur
- Evidence-based optimisation
- Improved cost control
- Greater confidence in Auto-Scale configuration
Auto-Scale stops feeling mysterious.
It becomes something you understand and control.
Common Mistakes to Avoid
Even experienced teams can misinterpret Auto-Scale behaviour.
Some common pitfalls include:
- Reviewing only one day of historical data
- Optimising around short-term anomalies
- Ignoring weekly or seasonal usage patterns
- Adjusting Auto-Scale settings without understanding triggers
Auto-Scale optimisation works best when decisions are based on consistent trends rather than isolated events.
Looking at several weeks of history often reveals the true behaviour of an environment.
How Habit #5 Builds on Habit #4
Habit #4 focused on Auto-Scale Insights.
Insights help surface potential optimisation opportunities — such as idle capacity or oversized VM SKUs.
Habit #5 goes one step further.
It explains why those opportunities exist.
When you combine insights with historical analysis, you create a powerful feedback loop:
Insights highlight optimisation opportunities.
History explains the behaviour behind them.
Together, they allow admins to refine Auto-Scale configurations with confidence.
The Operational Discipline Behind Great Environments
The most stable Azure Virtual Desktop (AVD) environments don’t rely on trial and error.
They rely on observation.
Highly effective teams treat Auto-Scale history as part of their operational routine.
They review it:
- During monthly environment reviews
- When investigating performance issues
- After major application or user changes
- When evaluating cost optimisation opportunities
Over time, this creates a deeper understanding of how the environment behaves.
And that understanding leads to better decisions.
The Real Takeaway
Auto-Scale isn’t magic.
It’s simply a system responding to signals.
When those signals are understood, scaling becomes predictable.
And predictable systems are easier to optimise.
That’s the real value of Habit #5.
Next in the series:
Habit #6 — Regularly Right-Size Using Nerdio Advisor
Even well-designed environments drift over time. The most effective admins continuously validate that their VM sizing still reflects real demand.

Leave a comment